Optimizing ESP32-S3 Performance: Why Smaller Code Can Ran Faster
I’ve been tuning the performance of some code recently on an ESP32-S3 project,
There was a slightly counter-intuitive result that might surprise some people: optimizing for code size produced faster runtime performance than optimizing for performance.
There’s a full video here - but you can skim this post for most of the information.
The Benchmark
This is just some code that I pulled out of my latest project. It’s not an official piece of benchmarking code. So your mileage will definitely vary and you shohld do your own tests on your own code.
I kept my test case was deliberately simple and pulled out the most performance critical part of my code.
The code, input data, and hardware stayed constant throughout. Only ESP-IDF configuration options were changed between runs.
Baseline Results
Starting from a stock ESP-IDF configuration (I used their hello_world starter app), the decode took roughly 1.4 seconds.
From there, I explored a few of the usual performance levers:
- CPU frequency (an obvious one!)
- Compiler optimization level
- Flash SPI mode
- Cache configuration
CPU Frequency: The Obvious Win
Unsurprisingly, increasing the CPU frequency from 160 MHz to 240 MHz produced an immediate improvement.
The result was roughly the 1.5× speed-up thst you woulld hope for (it was actually around 1.46 - but close enough).
Compiler Optimizations: Size vs Speed
ESP-IDF menu config offers two commonly used optimization modes:
- Optimize for size (
-Os) - Optimize for performance (
-O2)
Weirdly, in my first job (many years ago!), this was discussed in quite detail.
You naively expect that -O2 should be faster than -Os. In this case, it wasn’t.
With this workload, -Os outperformed -O2 quite significantly. They both beat the debug build - but -Os improved it the most.
Why Would Smaller Code Be Faster?
On the ESP32-S3, application code normally runs from flash memory with an instruction cache (you can actually copy code into PSRAM if it’s available which can be faster than flash).
Flash is pretty slow which means the CPU caches can have a significant impact.
- instruction cache size
- cache line fetches
- cache miss penalties
Optimizing for performance often:
- increases inlining
- unrolls loops
- duplicates code paths
All of this increases code size, which can lead to more instruction cache misses and more reads from the flash.
Optimizing for size does the opposite: it produces tighter code that is more likely to stay resident in the cache, reducing stalls caused by flash fetches.
In this workload, that effect outweighed the benefits of more aggressive instruction-level optimizations.
Flash Mode and Cache Configuration
Because the GIF was embedded in flash and accessed frequently, flash bandwidth also mattered.
Two changes helped further:
- Switching the flash SPI mode from DIO to QIO (chack that your module supports this!)
- Increasing instruction and data cache sizes to their maximum values
These changes reduced the cost of cache refills and improved overall throughput.
Interestingly, once the caches were enlarged, -O2 did improve — but it still didn’t beat the -Os configuration with the same cache settings.
The Winning Configuration
For this benchmark, the fastest setup was:
- CPU frequency: 240 MHz
- Compiler optimization: Optimize for size (
-Os) - Instruction & data cache: maximum (turn it up to 11!)
- Flash SPI mode: QIO
This combination produced the lowest overall decode time.
This is the case for my specific workload!
It’s important to be clear about the limits of this result.
You may not see the same behaviour if:
- Your hot code runs entirely from the instruction cache or IRAM
- Your workload is dominated by tight math loops on small datasets
- You’re memory-bandwidth bound on internal RAM rather than flash
In those cases, -O2 or even more aggressive optimization may still win.
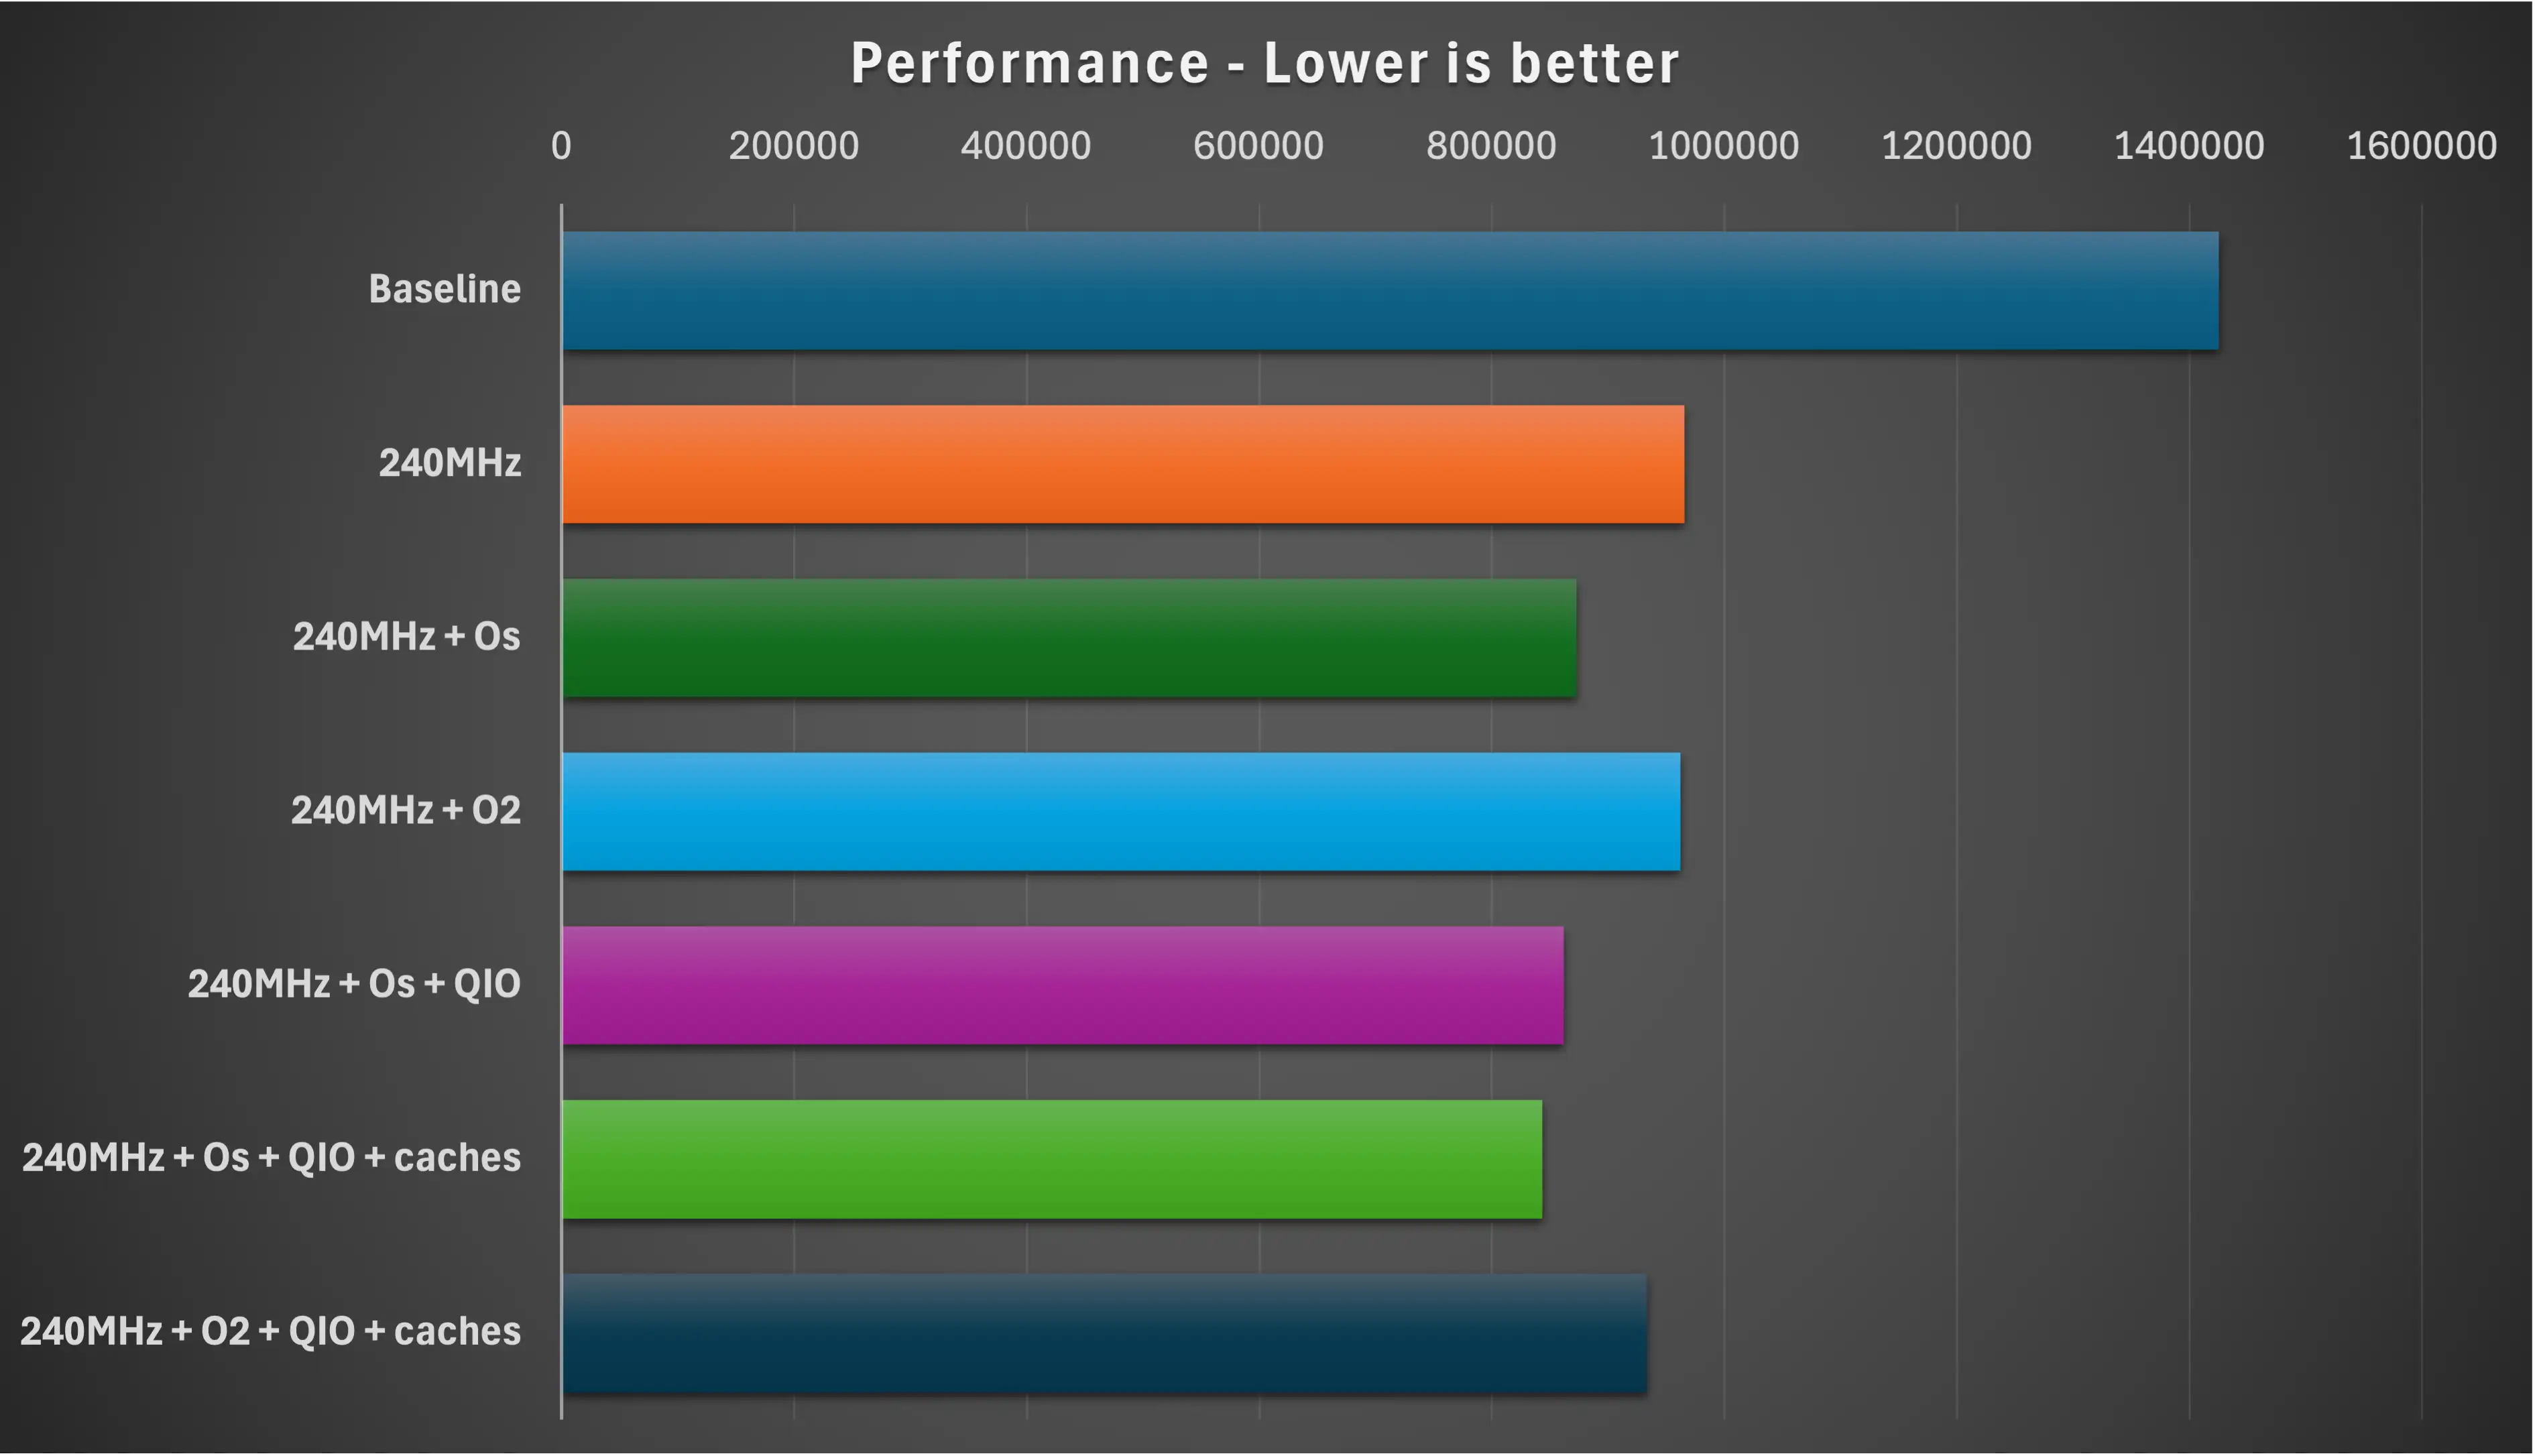
Full Results Table
| Build type | usecs | ms | % of baseline |
|---|---|---|---|
| Baseline | 1425476 | 1425.48 | 100 |
| 240MHz | 965408 | 965.4 | 67.72 |
| 240MHz + Os | 872495 | 872.5 | 61.21 |
| 240MHz + O2 | 962329 | 962.3 | 67.50 |
| 240MHz + Os + QIO | 861859 | 861.9 | 60.46 |
| 240MHz + Os + QIO + caches | 843286 | 843.3 | 59.16 |
| 240MHz + O2 + QIO + caches | 933093 | 933.1 | 65.46 |
Conclusions
Performance is often limited by memory and caching, not raw CPU execution.
Smaller code can mean fewer cache misses - and fewer cache misses can mean faster code.
If you’re working on performance-critical ESP-IDF projects, it’s worth benchmarking -Os alongside -O2.
If you’ve tried similar experiments on other ESP32 variants, I’d love to hear what you found.